Regional Overview 1998
HB regional overview 1
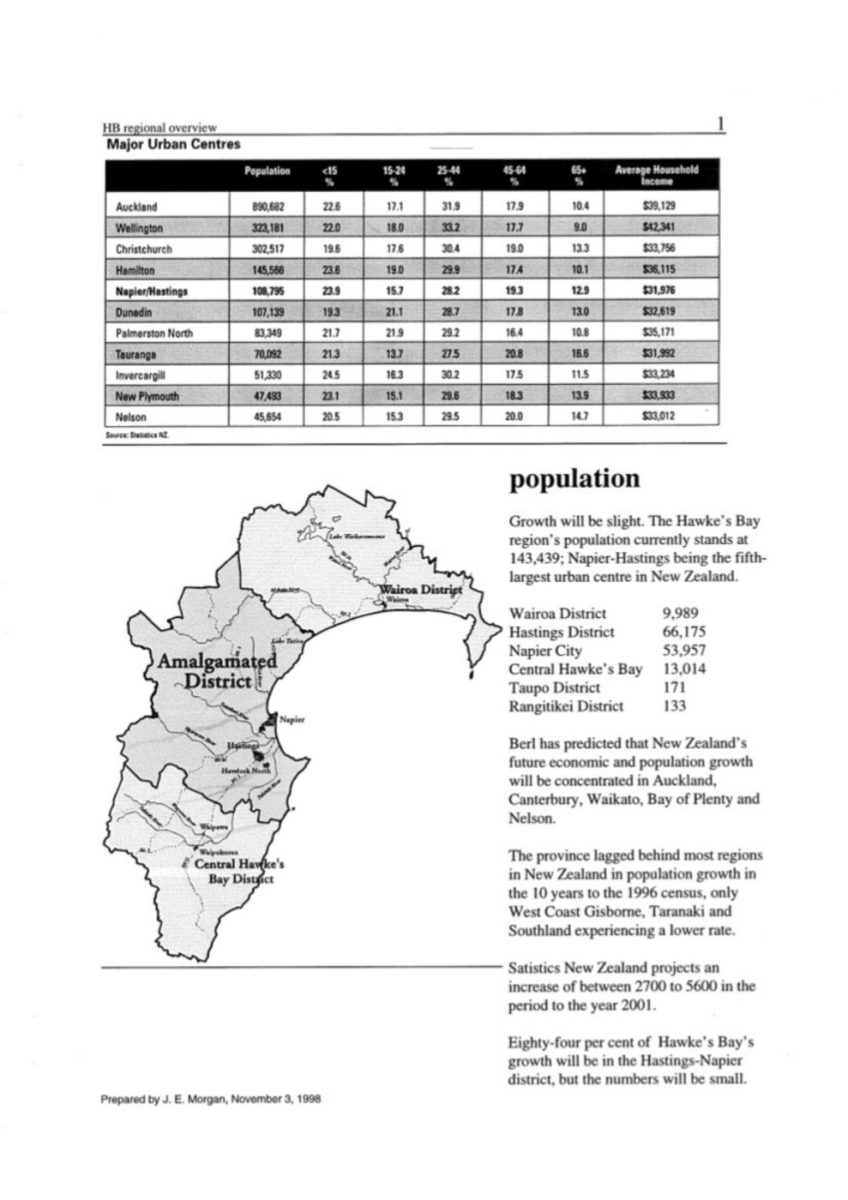
Major Urban Centres
Population <15% 15-24% 25-44% 45-64% 65+% Average Household Income
Auckland 890,682 22.6 17.1 31.9 17.9 10.4 $39,129
Wellington 323,181 22.0 18.0 33.2 17.7 9.0 $42,341
Christchurch 302,517 19.6 17.6 30.4 19.0 13.3 $33,756
Hamilton 145,566 23.6 19.0 29.9 17.4 10.1 $36,115
Napier/Hastings 108,795 23.9 15.7 28.2 19.3 12.9 $31,976
Dunedin 107,139 19.3 21.1 28.7 17.8 13.0 $32,619
Palmerston North 83,349 21.7 21.9 29.2 16.4 10.8 $35,171
Tauranga 70,092 21.3 13.7 27.5 20.8 16.6 $31,992
Invercargill 51,330 24.5 16.3 30.2 17.5 11.5 $33,234
New Plymouth 47,493 23.1 15.1 29.6 18.3 13.9 $33,933
Nelson 45,654 20.5 15.3 29.5 20.0 14.7 $33,012
Source: Statistics NZ.
population
Growth will be slight. The Hawke’s Bay region’s population currently stands at 143,439; Napier-Hastings being the fifth-largest urban centre in New Zealand.
Wairoa District 9,989
Hastings District 66,175
Napier City 53,957
Central Hawke’s Bay 13,014
Taupo District 171
Rangitikei District 133
Berl has predicted that New Zealand’s future economic and population growth will be concentrated in Auckland, Canterbury, Waikato, Bay of Plenty and Nelson.
The province lagged behind most regions in New Zealand in population growth in the 10 years to the 1996 census, only West Coast Gisborne, Taranaki and Southland experiencing a lower rate.
Statistics New Zealand projects an increase of between 2700 to 5600 in the period to the year 2001.
Eighty-four per cent of Hawke’s Bay’s growth will be in the Hastings-Napier district, but the numbers will be small.
Prepared by J. E. Morgan, November 3, 1998
HB regional overview 2
trade
Hawke’s Bay depends predominantly on what it can grow: pastoral farming, fruitgrowing, process cropping, market gardening, viticulture, forestry.
Accordingly, it is subject to the vagaries of the international marketplace. Forecasts in late October of recession in Europe and the United States were early warnings of more trouble ahead for an export sector already hard hit by the 16-month-old Asian financial crisis.
Britain and the US are predicted to go into recession in the middle of next year. Reports from Europe say the spreading Asian contagion has begun to slow growth in that region.
Slumps in commodity prices and a slowdown in drought-affected exports can only worsen Hawke’s Bay’s lot, if the predicted recessions occur.
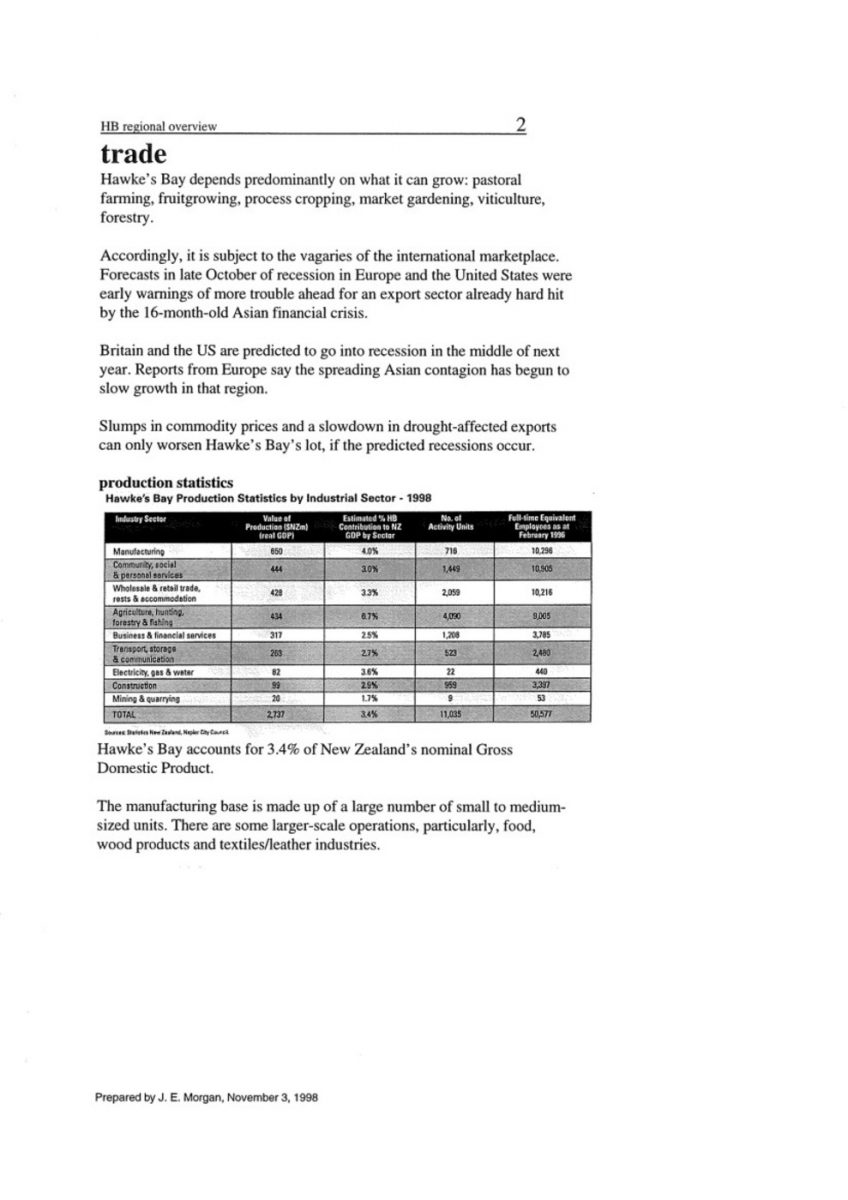
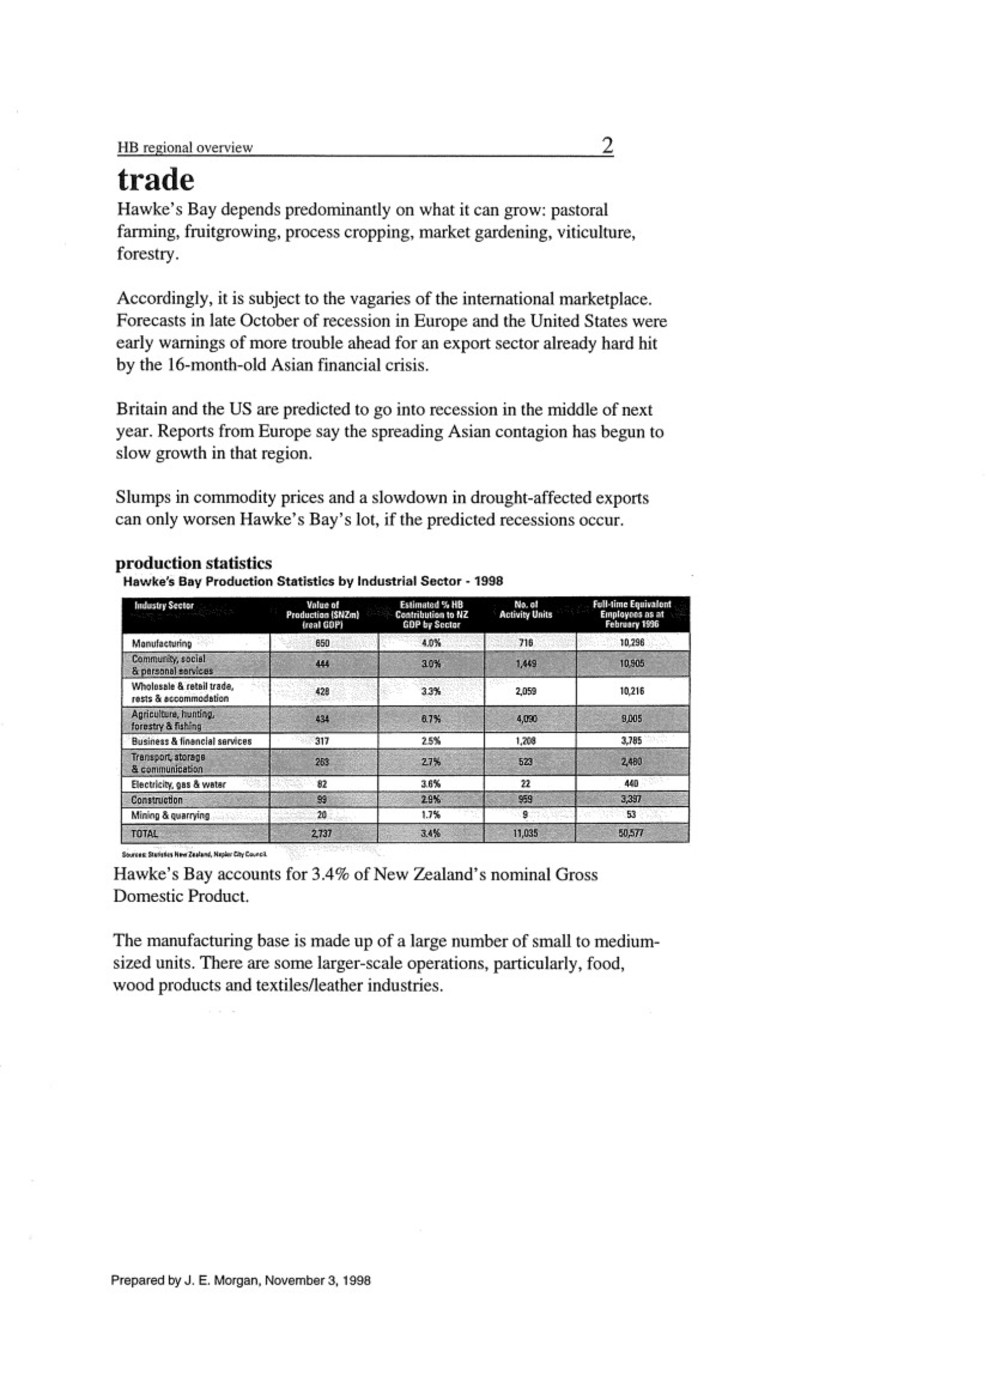
production statistics
Hawke’s Bay Production Statistics by Industrial Sector – 1998
Industry Sector Value of Production ($NZm) (real GDP) Estimated % HB Contribution to NZ GDP by Sector No. of Activity Units Full-time Equivalent Employees as at February 1996
Manufacturing 650 4.0% 716 10,296
Community, social & personal services 444 3.0% 1,449 10,905
Wholesale & retail trade, rests & accommodation 428 3.3% 2,059 10,216
Agriculture, hunting, forestry & fishing 434 6.7% 4,090 9,005
Business & financial services 317 2.5% 1,208 3,785
Transport, storage & communication 263 2.7% 523 2,480
Electricity, gas & water 82 3.6% 22 440
Construction 99 2.9% 959 3,397
Mining & quarrying 20 1.7% 9 53
TOTAL 2,737 3.4% 11,035 50,577
Sources: Statistics New Zealand, Napier City Council
Hawke’s Bay accounts for 3.4% of New Zealand’s nominal Gross Domestic Product.
The manufacturing base is made up of a large number of small to medium-sized units. There are some larger-scale operations, particularly, food, wood products and textiles/leather industries.
Prepared by J. E. Morgan, November 3, 1998
HB regional overview 3
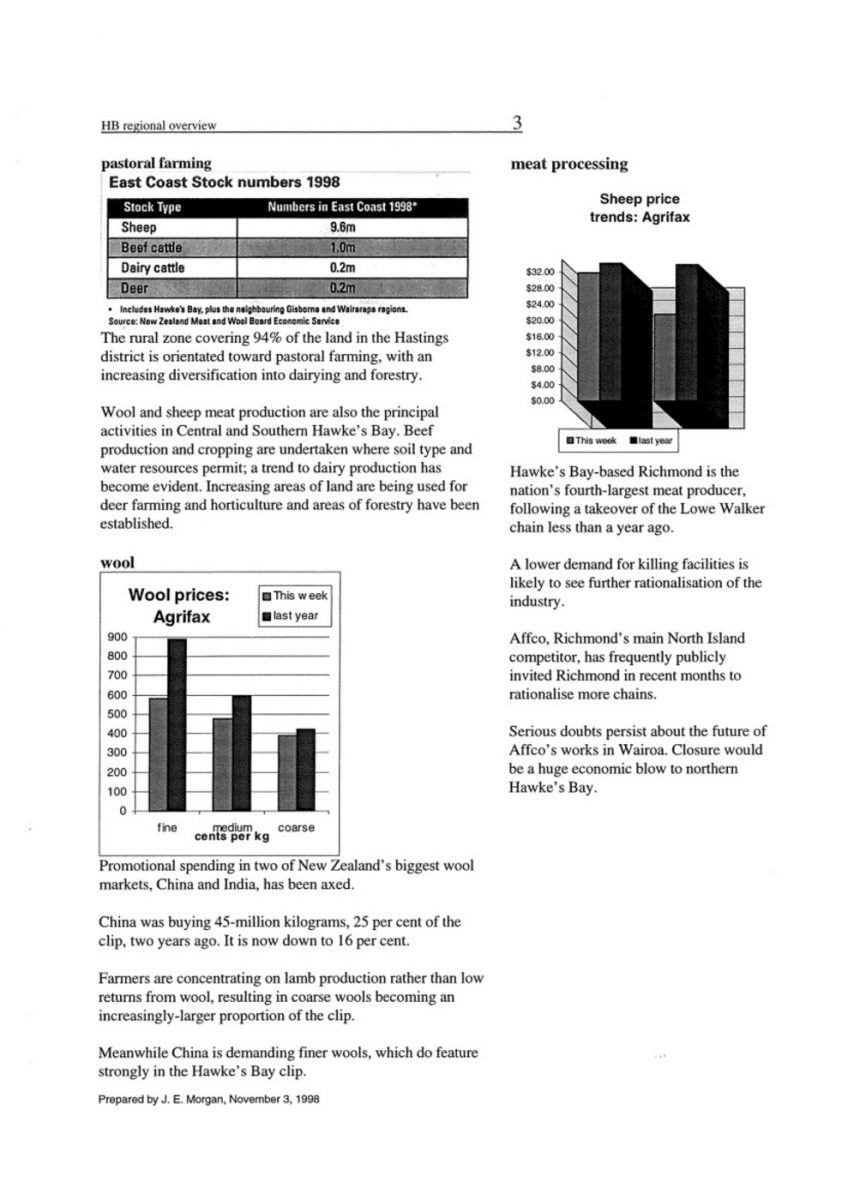
pastoral farming
East Coast Stock numbers 1998
Stock Type Numbers in East Coast 1998*
Sheep 9.6m
Beef cattle 1.0m
Dairy cattle 0.2m
Deer 0.2m
* Includes Hawke’s Bay, plus the neighbouring Gisborne and Wairarapa regions.
Source: New Zealand Meat and Wool Board Economic Service
The rural zone covering 94% of the land in the Hastings district is orientated towards pastoral farming, with an increasing diversification into dairying and forestry.
Wool and sheep meat production are also the principal activities in Central and Southern Hawke’s Bay. Beef production and cropping are undertaken where soil type and water resources permit; a trend to dairy production has become evident. Increasing areas of land are being used for deer farming and horticulture and areas of forestry have been established.
wool
Promotional spending in two of New Zealand’s biggest wool markets, China and India, has been axed.
China was buying 45-million kilograms, 25 per cent of the clip, two years ago. It is now down to 16 per cent.
Farmers are concentrating on lamb production rather than low returns from wool, resulting in coarse wools becoming an increasingly-larger proportion of the clip.
Meanwhile China is demanding finer wools, which do feature strongly in the Hawke’s Bay clip.
Meat processing
Hawke’s Bay-based Richmond is the nation’s fourth-largest meat producer, following a takeover of the Lowe Walker chain less than a year ago.
A lower demand for killing facilities is likely to see further rationalisation of the industry.
Affco, Richmond’s main North Island competitor, has frequently publicly invited Richmond in recent months to rationalise more chains.
Serious doubts persist about the future of Affco’s works in Wairoa. Closure would be a huge economic blow to northern Hawke’s Bay.
Prepared by J. E. Morgan, November 3, 1998
HB regional overview 4
pipfruit, horticulture, market gardening
Hastings district is New Zealand’s largest producer of apples, pears, peaches, nectarines and apricots, sweetcorn, tomatoes and squash. It is the nation’s second-largest producer of grapes and wines – 25% of the national crop.
The plains area is served by an aquifer system, known to be more than 200 metres deep and extending 20km out into Hawke Bay. The aquifer is the main ground-water resource for the Heretaunga Plains, Hastings and Napier communities, providing 85% of water requirements.
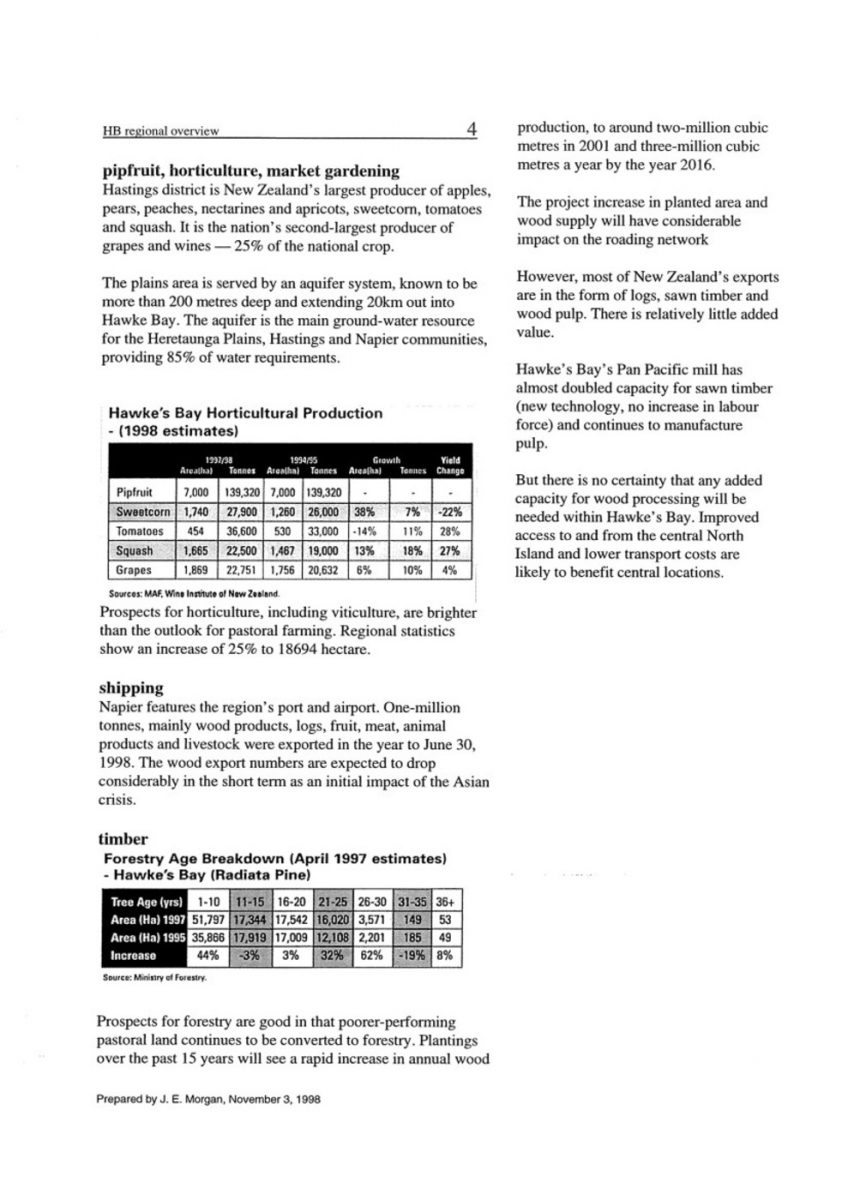
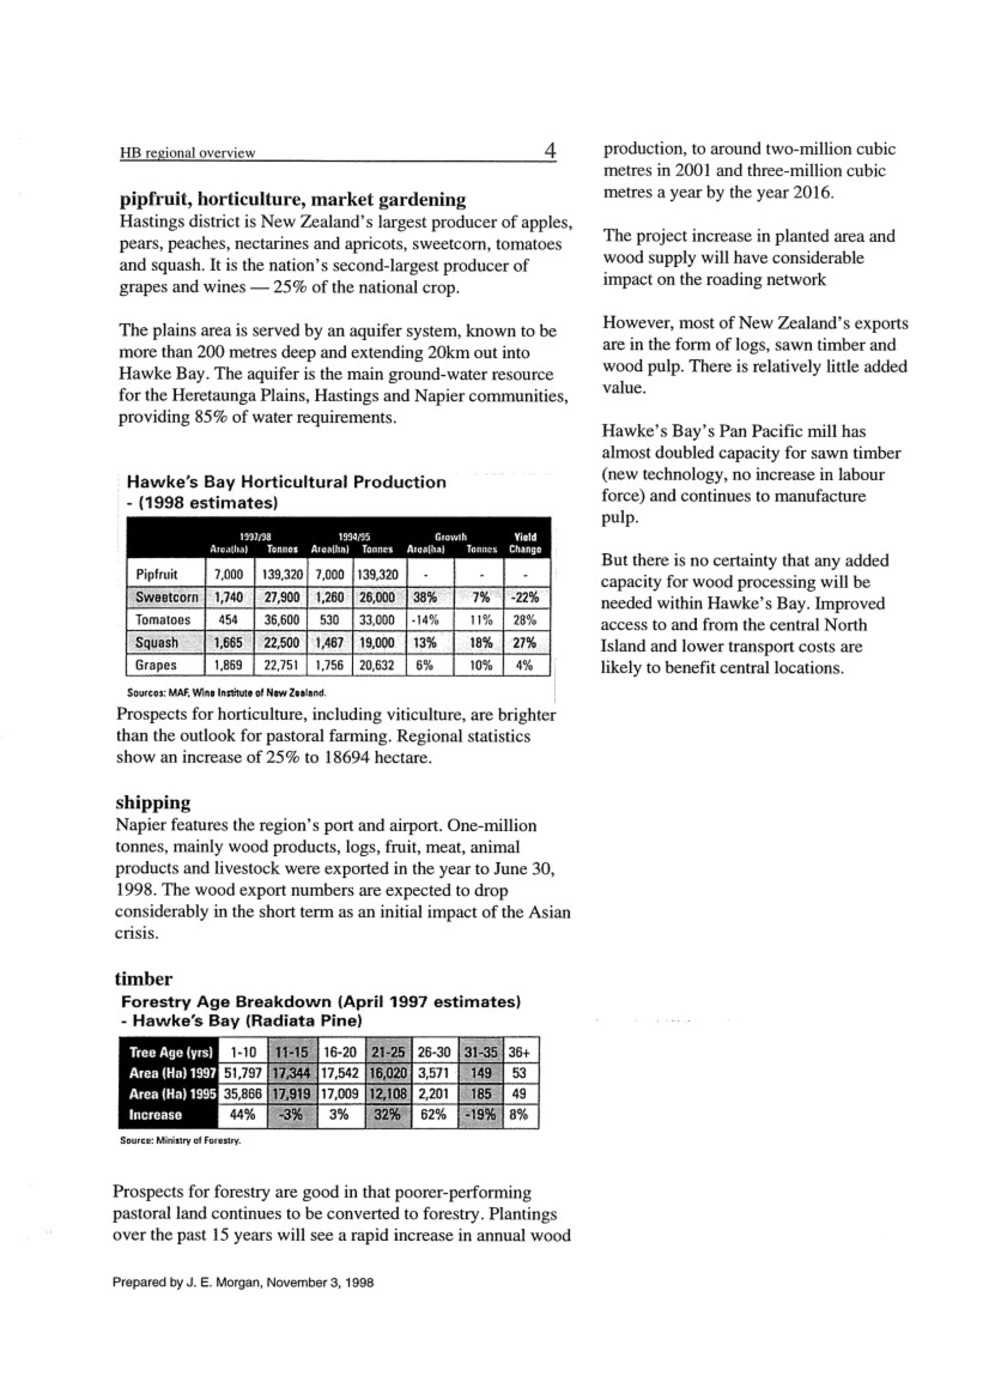
Hawke’s Bay Horticultural Production – (1998 estimates)
1997/98 1994/95 Growth Yield
Area(ha) Tonnes Area(ha) Tonnes Area(ha) Tonnes Change
Pipfruit 7,000 139,320 7,000 139,320 – – –
Sweetcorn 1,740 27,900 1,260 26,000 38% 7% -22%
Tomatoes 454 36,600 530 33,000 -14% 11% 28%
Squash 1,665 22,500 1,467 19,000 13% 18% 27%
Grapes 1,869 22,751 1,756 20,632 6% 10% 4%
Sources: MAF, Wine Institute of New Zealand.
Prospects for horticulture, including viticulture, are brighter than the outlook for pastoral farming. Regional statistics show an increase of 25% to 18694 hectare.
shipping
Napier features the region’s port and airport. One-million tonnes, mainly wood products, logs, fruit, meat, animal products and livestock were exported in the year to June 30, 1998. The wood export numbers are expected to drop considerably in the short term as an initial impact of the Asian crisis.
timber
Forestry Age Breakdown (April 1997 estimates) – Hawke’s Bay (Radiata Pine)
Tree Age (yrs) 1-10 11-15 16-20 21-25 36-30 31-35 36+
Area (Ha) 1997 51,797 17,344 17,542 16,020 3,571 149 53
Area (Ha) 1995 35.866 17,919 17,009 12,108 2,201 185 49
Increase 44% -3% 3% 32% 62% -19% 8%
Source: Ministry of Forestry.
Prospects for forestry are good in that poorer-performing pastoral land continues to be converted to forestry. Plantings over the past 15 years will see a rapid increase in annual wood production, to around two-million cubic metres in 2001 and three-million cubic metres a year by the year 2016.
The project [projected] increase in planted area and wood supply will have considerable impact on the roading network
However, most of New Zealand’s exports are in the form of logs, sawn timber and wood pulp. There is relatively little added value.
Hawke’s Bay’s Pan Pacific mill has almost doubled capacity for sawn timber (new technology, no increase in labour force) and continues to manufacture pulp.
But there is no certainty that any added capacity for wood processing will be needed within Hawke’s Bay. Improved access to and from the central North Island and lower transport costs are likely to benefit central locations.
Prepared by J. E. Morgan, November 3, 1998
HB regional overview 5
commodity prices
The short-term outlook for New Zealand agriculture is one of slow recovery of product prices from a low base.
Sheepmeats, beef, venison and wool are expected to improve marginally. Dairy prices are likely to remain static for the next 2-3 years. Any substantial movement in product prices will have to come from improved marketing.
Given the present uncertain future of producer boards, with it collectively their ability to market New Zealand produce, it would be unwise to count on a noticeable improvement in marketing over the next couple of years.
drought impact
Last year’s drought, which caused heavy destocking of Hawke’s Bay farms is replicating itself. The water and atmospheric research institute’s October 1998 weather summary shows Hawke’s Bay having less than a third of normal rainfall and a marked drop in soil moisture.
Environmental officers report groundwater levels starting their steep summer drop six weeks early. Process crop growers are reporting paddocks too dry to sow seed.
Farmers, with stock depleted from last year’s drought, are quitting even more animals.
Ministry of Agriculture estimates the loss from pastoral farming and dairying at $30-million in Hawke’s Bay for 1997/98 and estimates the loss for 1998/99 at $75-million.
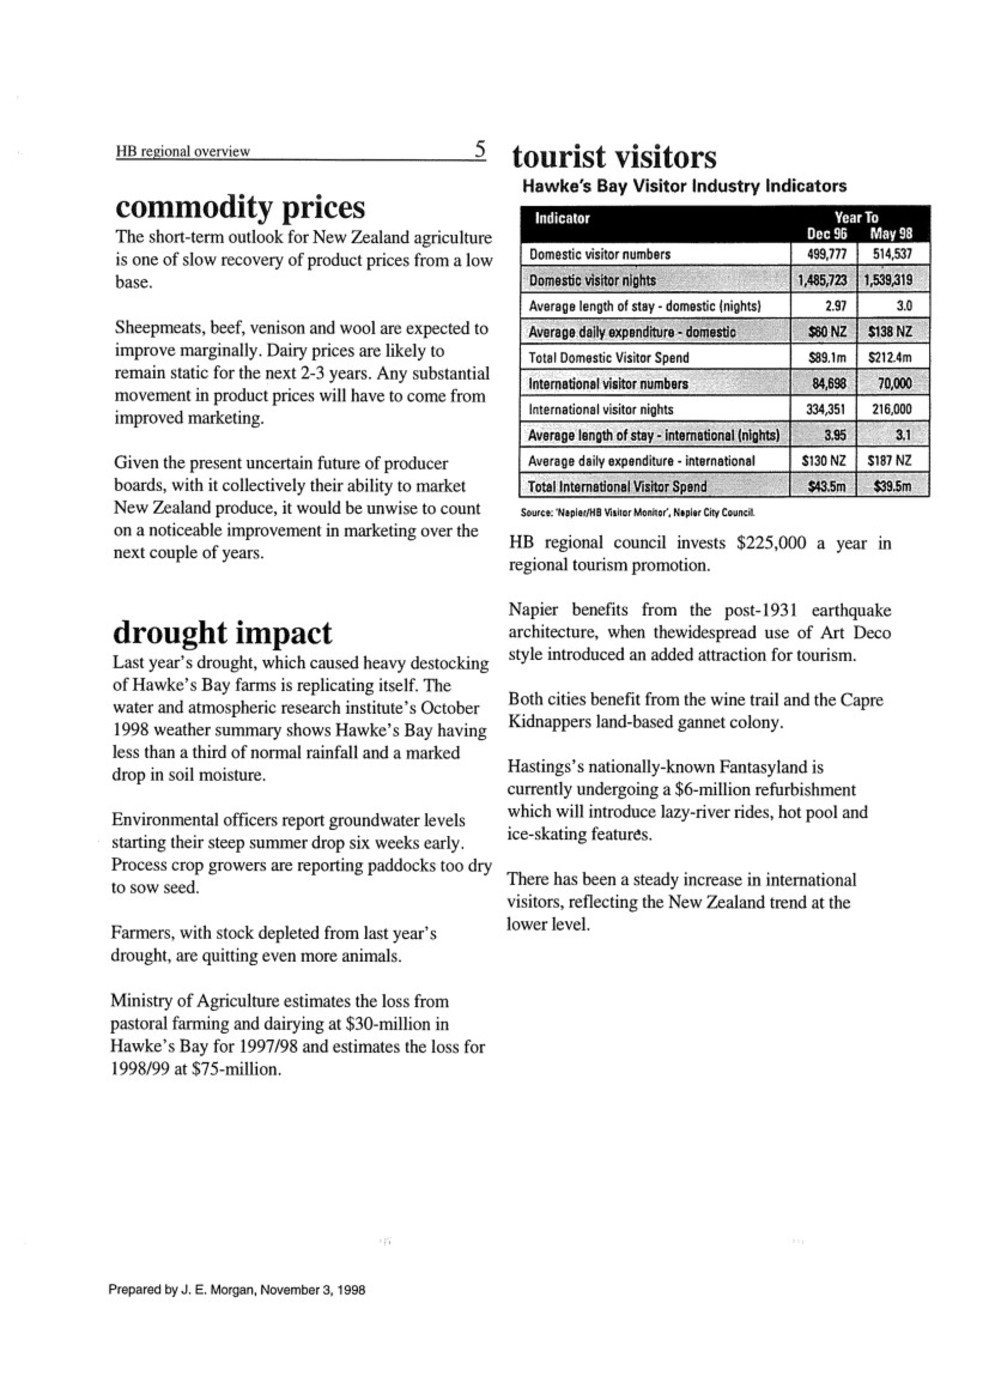
tourist visitors
Hawkes Bay Visitor Industry Indicators
Indicator year to
Dec 96 May 98
Domestic visitor numbers 499,777 514,537
Domestic visitor nights 1,485,723 1,539,319
Average length of stay – domestic (nights) 2.97 3.0
Average daily expenditure – domestic $60 NZ $138 NZ
Total Domestic Visitor Spend $89.1m $212.4m
International visitor numbers 84,698 70,000
International visitor nights 334,351 216,000
Average length of stay – international (nights) 3.95 3.1
Average daily expenditure – international $130 NZ $187 NZ
Total International Visitor Spend $43.5m $39.5m
Source: ‘Napier/HB Visitor Monitor’, Napier City Council.
HB regional council invests $225,000 a year in regional tourism promotion.
Napier benefits from the post-1931 earthquake architecture, when the widespread use of Art Deco style introduced an added attraction for tourism.
Both cities benefit from the wine trail and the Cape Kidnappers land-based gannet colony.
Hastings’s nationally-known Fantasyland is currently undergoing a $6-million refurbishment which will introduce lazy-river rides, hot pool and ice-skating features.
There has been a steady increase in international visitors, reflecting the New Zealand trend at the lower level.

HB regional overview 6
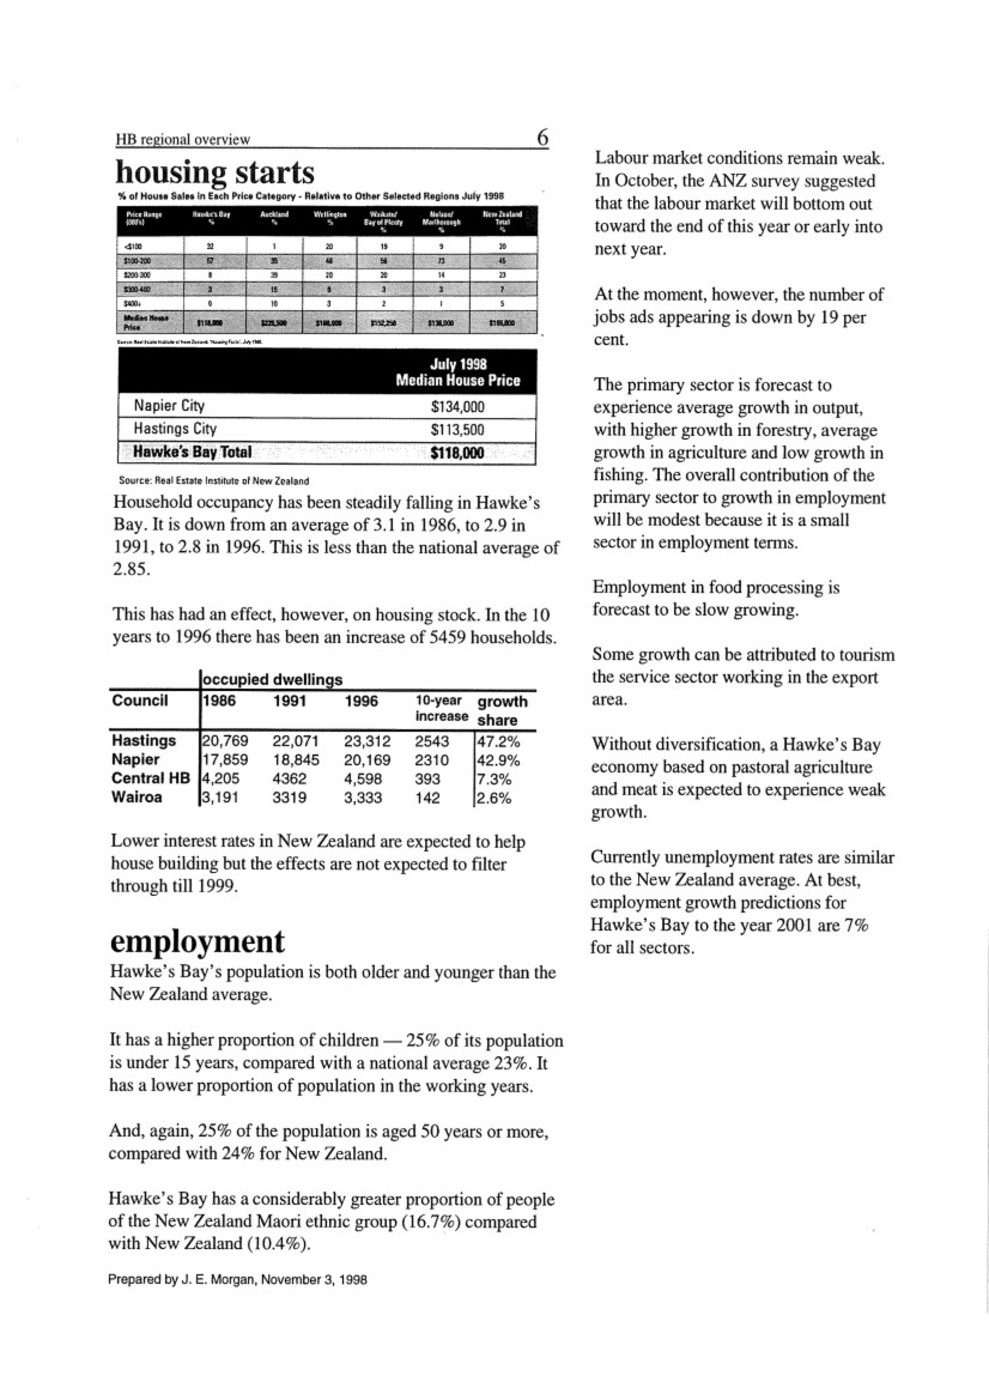
Housing starts [stats]
% of House Sales in Each Price Category – Relative to Other Selected Regions July 1998
Price Range (000’s) Hawke’s Bay% Auckland% Wellington% Waikato/Bay of Plenty% Nelson/Marlborough% New Zealand Total %
<100 32 1 20 19 9 20
$100-200 57 35 48 56 73 45
$200-300 8 39 20 20 14 23
$300-400 3 15 9 3 3 7
$400+ 0 10 3 2 1 5
Median House Price $118,000 $225,500 $168.000 $152,250 $136,000 $165,000
July 1998
Median House Price
Napier City $134,000
Hastings City $113,500
Hawke’s Bay Total $118,000
Source: Real Estate Institute of New Zealand
Household occupancy has been steadily falling in Hawke’s Bay. It is down from an average of 3.1 in 1986, to 2.9 in 1991, to 2.8 in 1996. This is less than the national average of 2.85.
This has had an effect, however, on housing stock. In the 10 years to 1996 there has been an increase of 5459 households.
Occupied dwellings
Council 1986 1991 1996 10-year increase growth share
Hastings 20,769 22,071 23,312 2543 47.2%
Napier 17,859 18,845 20,169 2310 42.9%
Central HB 4,205 4362 4,598 393 7.3%
Wairoa 3,191 3319 3,333 142 2.6%
Lower interest rates in New Zealand are expected to help house building but the effects are not expected to filter through till 1999.
employment
Hawke’s Bay’s population is both older and younger than the New Zealand average.
It has a higher proportion of children – 25% of its population is under 15 years, compared with a national average 23%. It has a lower proportion of population in the working years.
And, again, 25% of the population is aged 50 years or more, compared with 24% for New Zealand.
Hawke’s Bay has a considerably greater proportion of people of the New Zealand Maori ethnic group (16.7%) compared with New Zealand (10.4%)
Labour market conditions remain weak. In October, the ANZ survey suggested that the labour market will bottom out toward the end of this year or early into next year.
At the moment, however, the number of jobs ads appearing is down by 19 per cent.
The primary sector is forecast to experience average growth in output, with higher growth in forestry, average growth in agriculture and low growth in fishing. The overall contribution of the primary sector to growth in employment will be modest because it is a small sector in employment terms.
Employment in food processing is forecast to be slow growing.
Some growth can be attributed to tourism the service sector working in the export area.
Without diversification, a Hawke’s Bay economy based on pastoral agriculture and meat is expected to experience weak growth.
Currently unemployment rates are similar to the New Zealand average. At best, employment growth predictions for Hawke’s Bay to the year 2001 are 7% for all sectors.
Prepared by J. E. Morgan, November 3, 1998

Original digital file
MorganJE737-5_RegionalOverview.pdf
Non-commercial use

This work is licensed under a Attribution-NonCommercial 3.0 New Zealand (CC BY-NC 3.0 NZ).
Commercial Use
Please contact us for information about using this material commercially.Can you help?
The Hawke's Bay Knowledge Bank relies on donations to make this material available. Please consider making a donation towards preserving our local history.
Visit our donations page for more information.
Subjects
Format of the original
Computer documentDate published
3 November 1998Accession number
557928Supporters and sponsors
We sincerely thank the following businesses and organisations for their support.


Do you know something about this record?
Please note we cannot verify the accuracy of any information posted by the community.